Buildings Explorer
Overview
The Buildings Explorer is the central hub for interacting with building data in Onboard. Designed for speed, flexibility, and clarity, it offers a seamless way to navigate between buildings, equipment, and points, all within a single interface. It enables quick visual analysis of system performance, drift, and potential faults.
Key Features
- Data at a Glance: View key building and equipment data instantly without switching tabs
- Powerful Filtering: Slice and dice your data with advanced filters to focus on specific equipment, sensors, or buildings
- Multi-Building Comparison: Analyze and compare trends across multiple buildings or equipment side by side for faster insight
- Save Your Views: Bookmark the Explorer URL in your browser to revisit your exact selections and configurations anytime
- Smooth, Fast Navigation: Move effortlessly between buildings, equipment, points, and trend data in one connected flow
Navigating the Explorer
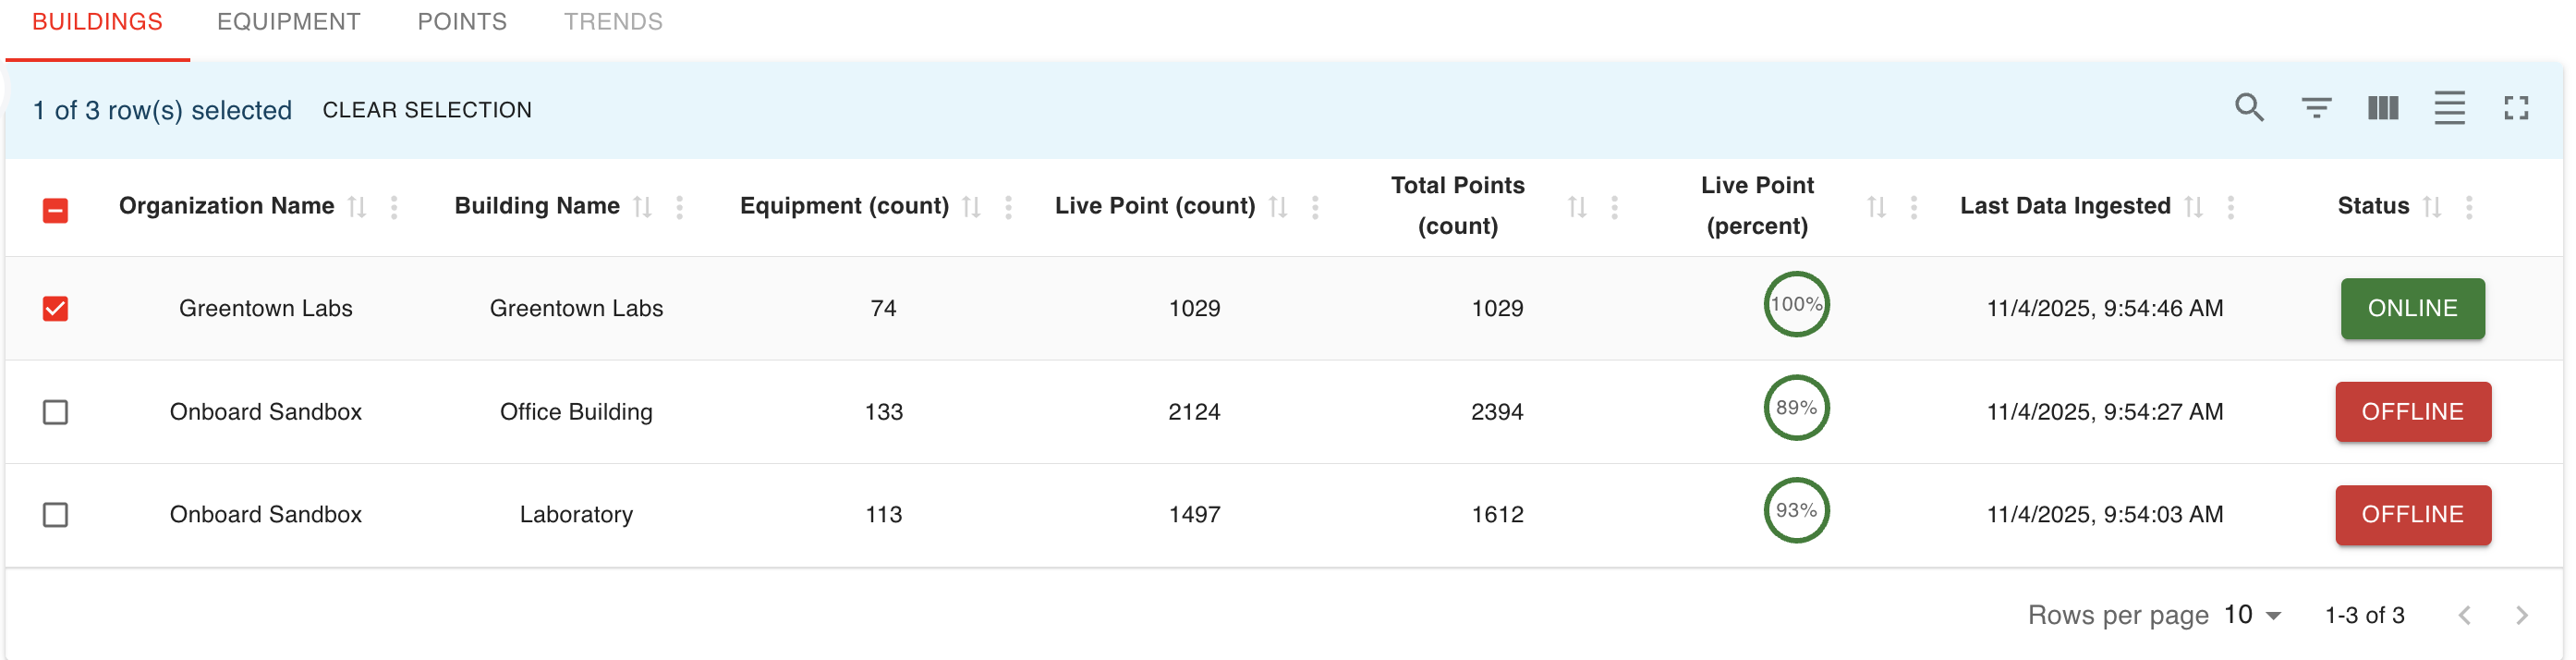
1. Start on the Buildings Tab
It displays all buildings associated with your account. Use this as your starting point to select one or more buildings whose live data you want to view.
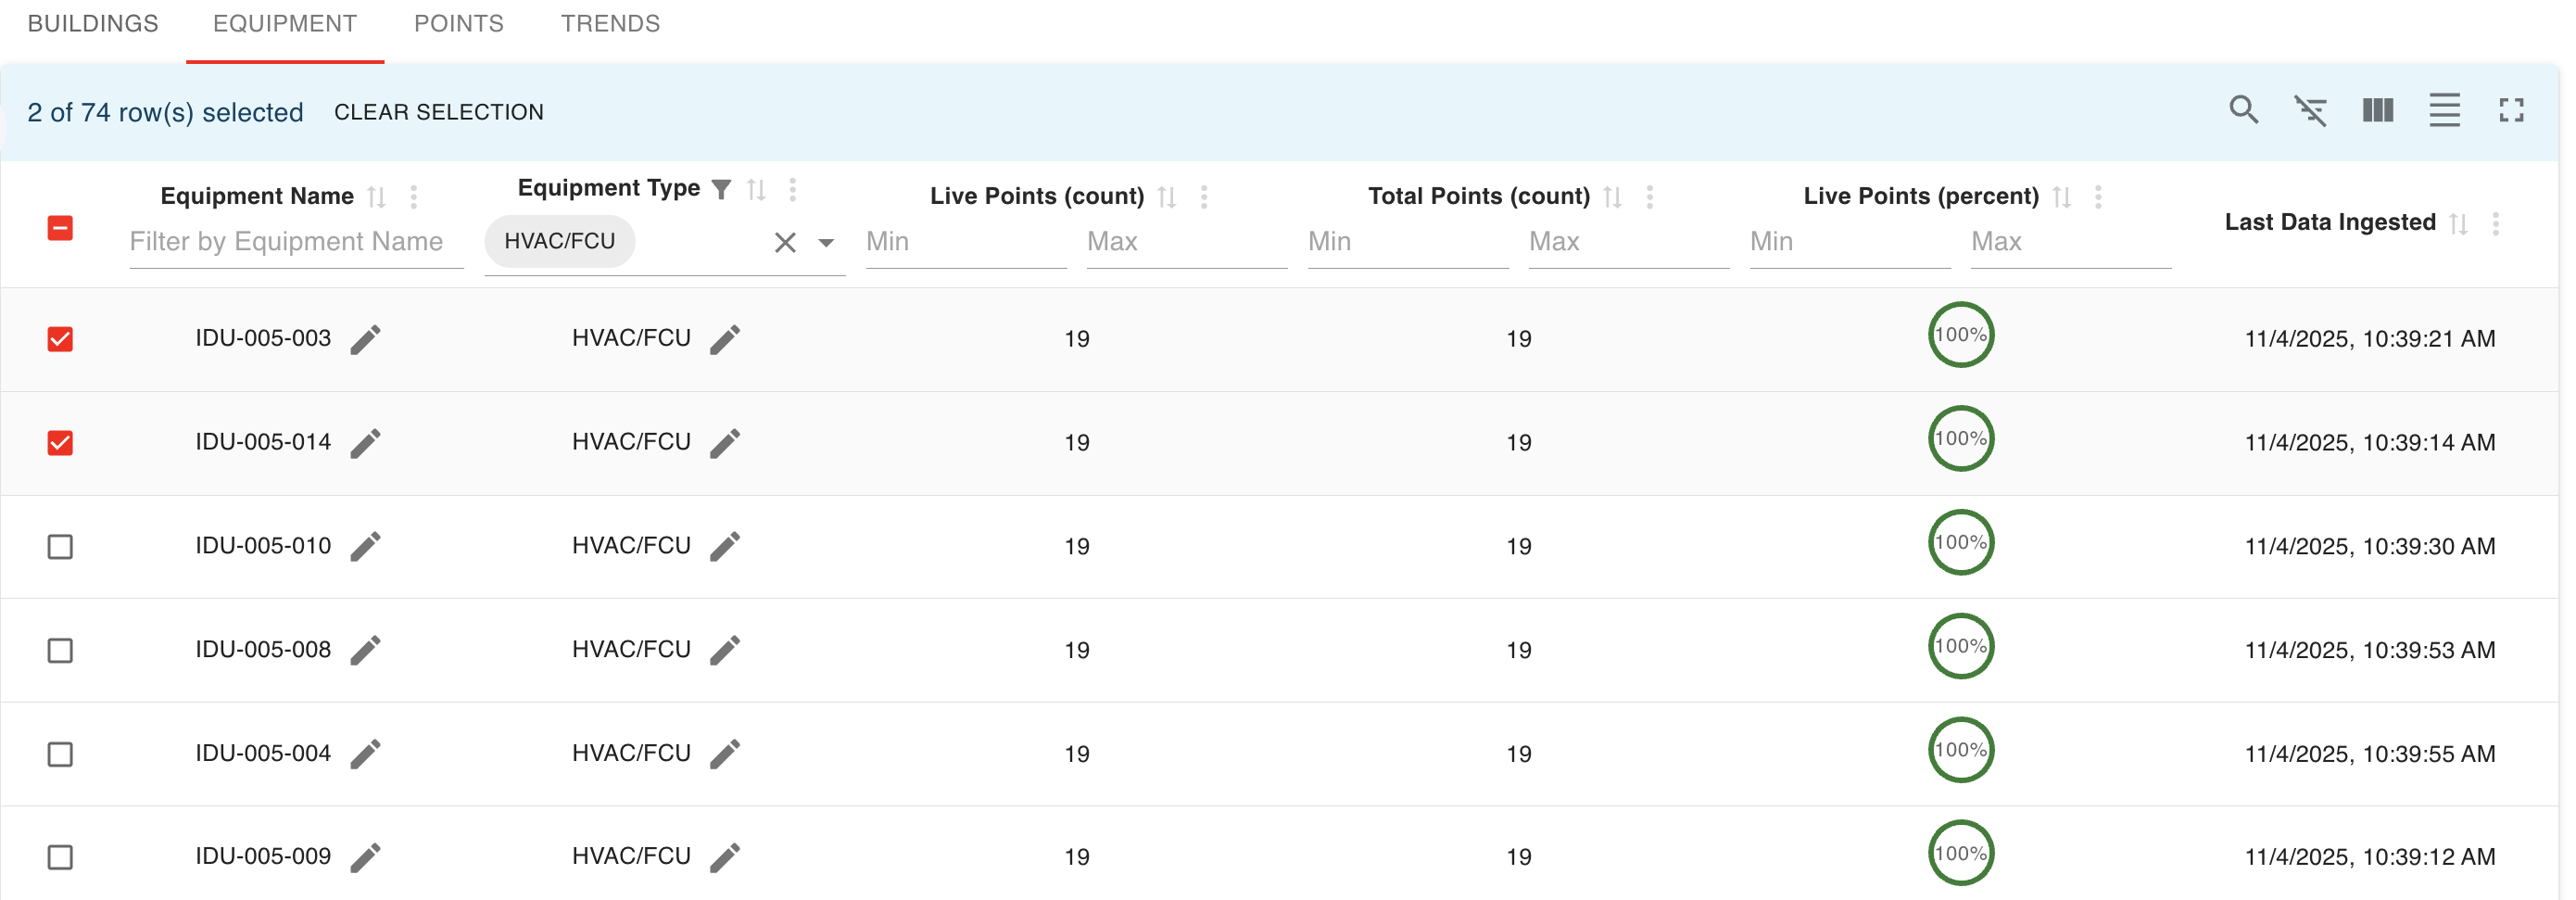
2. Go to the Equipment Tab
It shows all equipment such as HVAC systems and meters within the selected building(s). Use filters to quickly refine by equipment name, type, or point status.
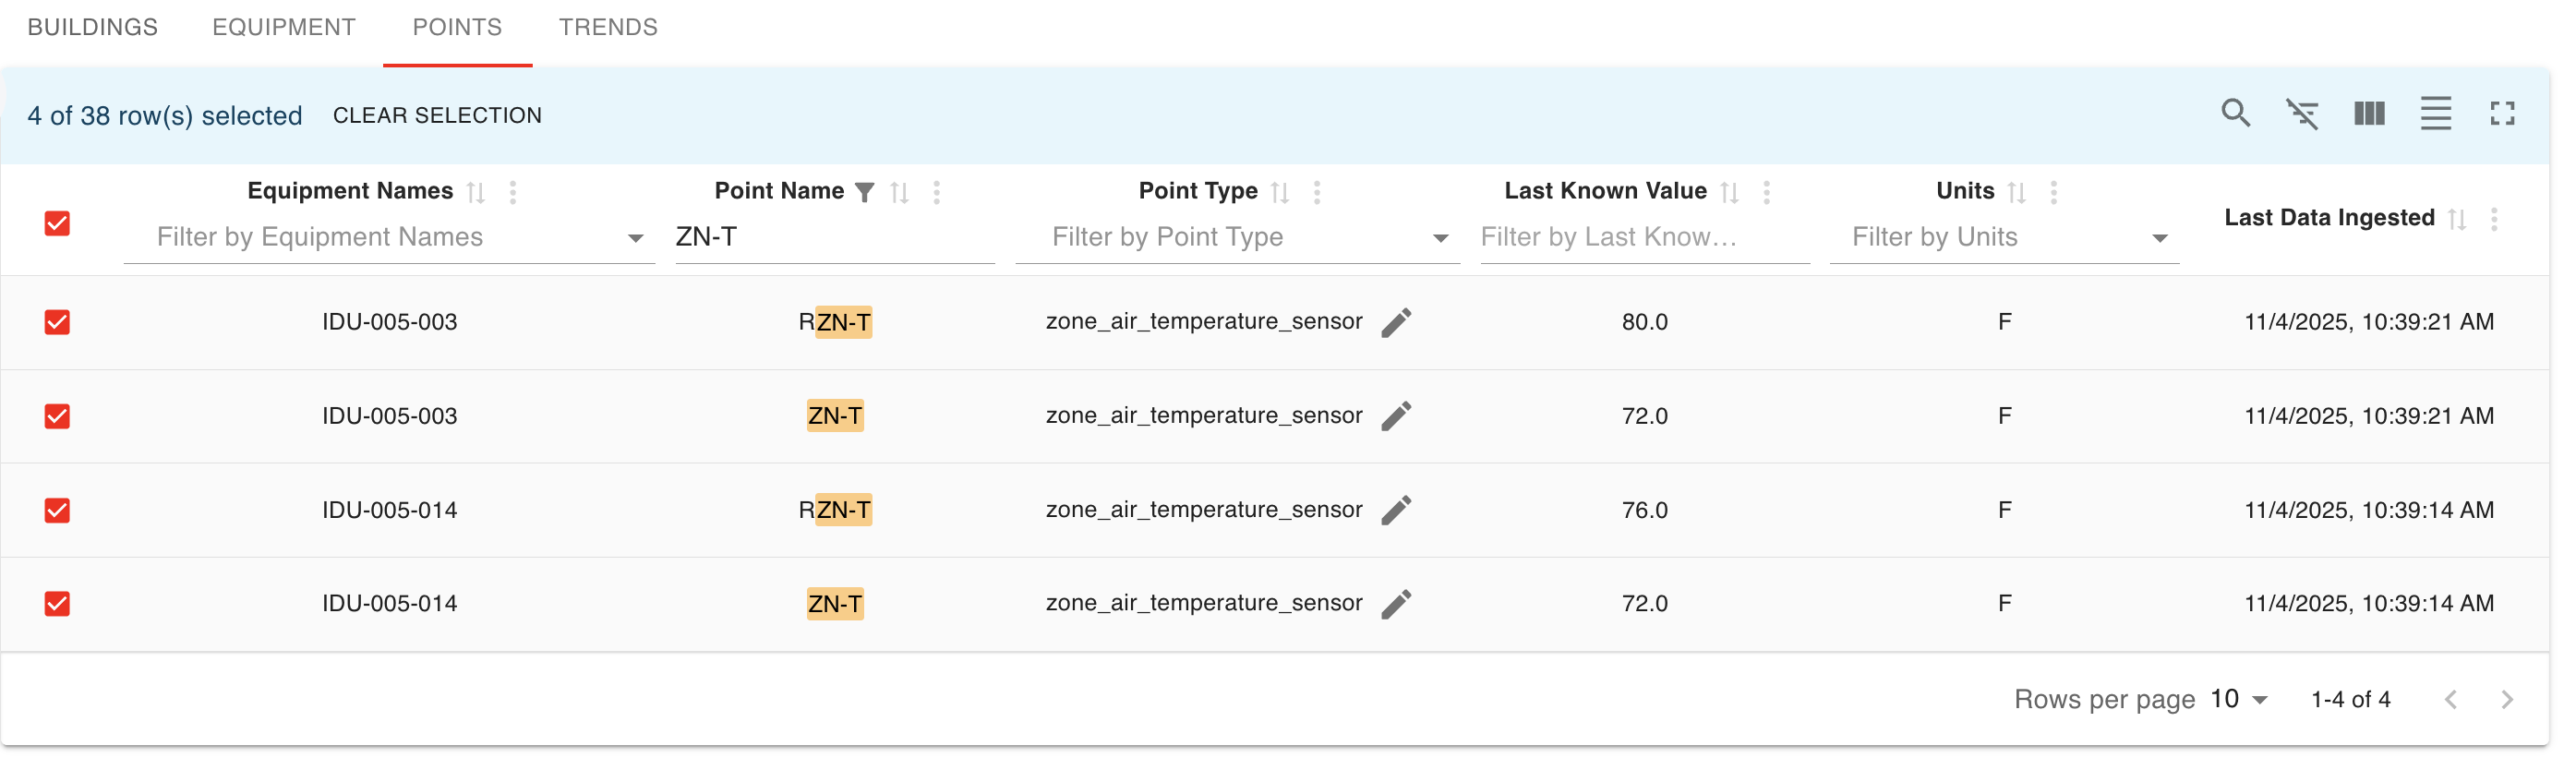
3. Open the Points Tab
It lists individual live points (sensors, setpoints, and states) associated with the selected equipment.
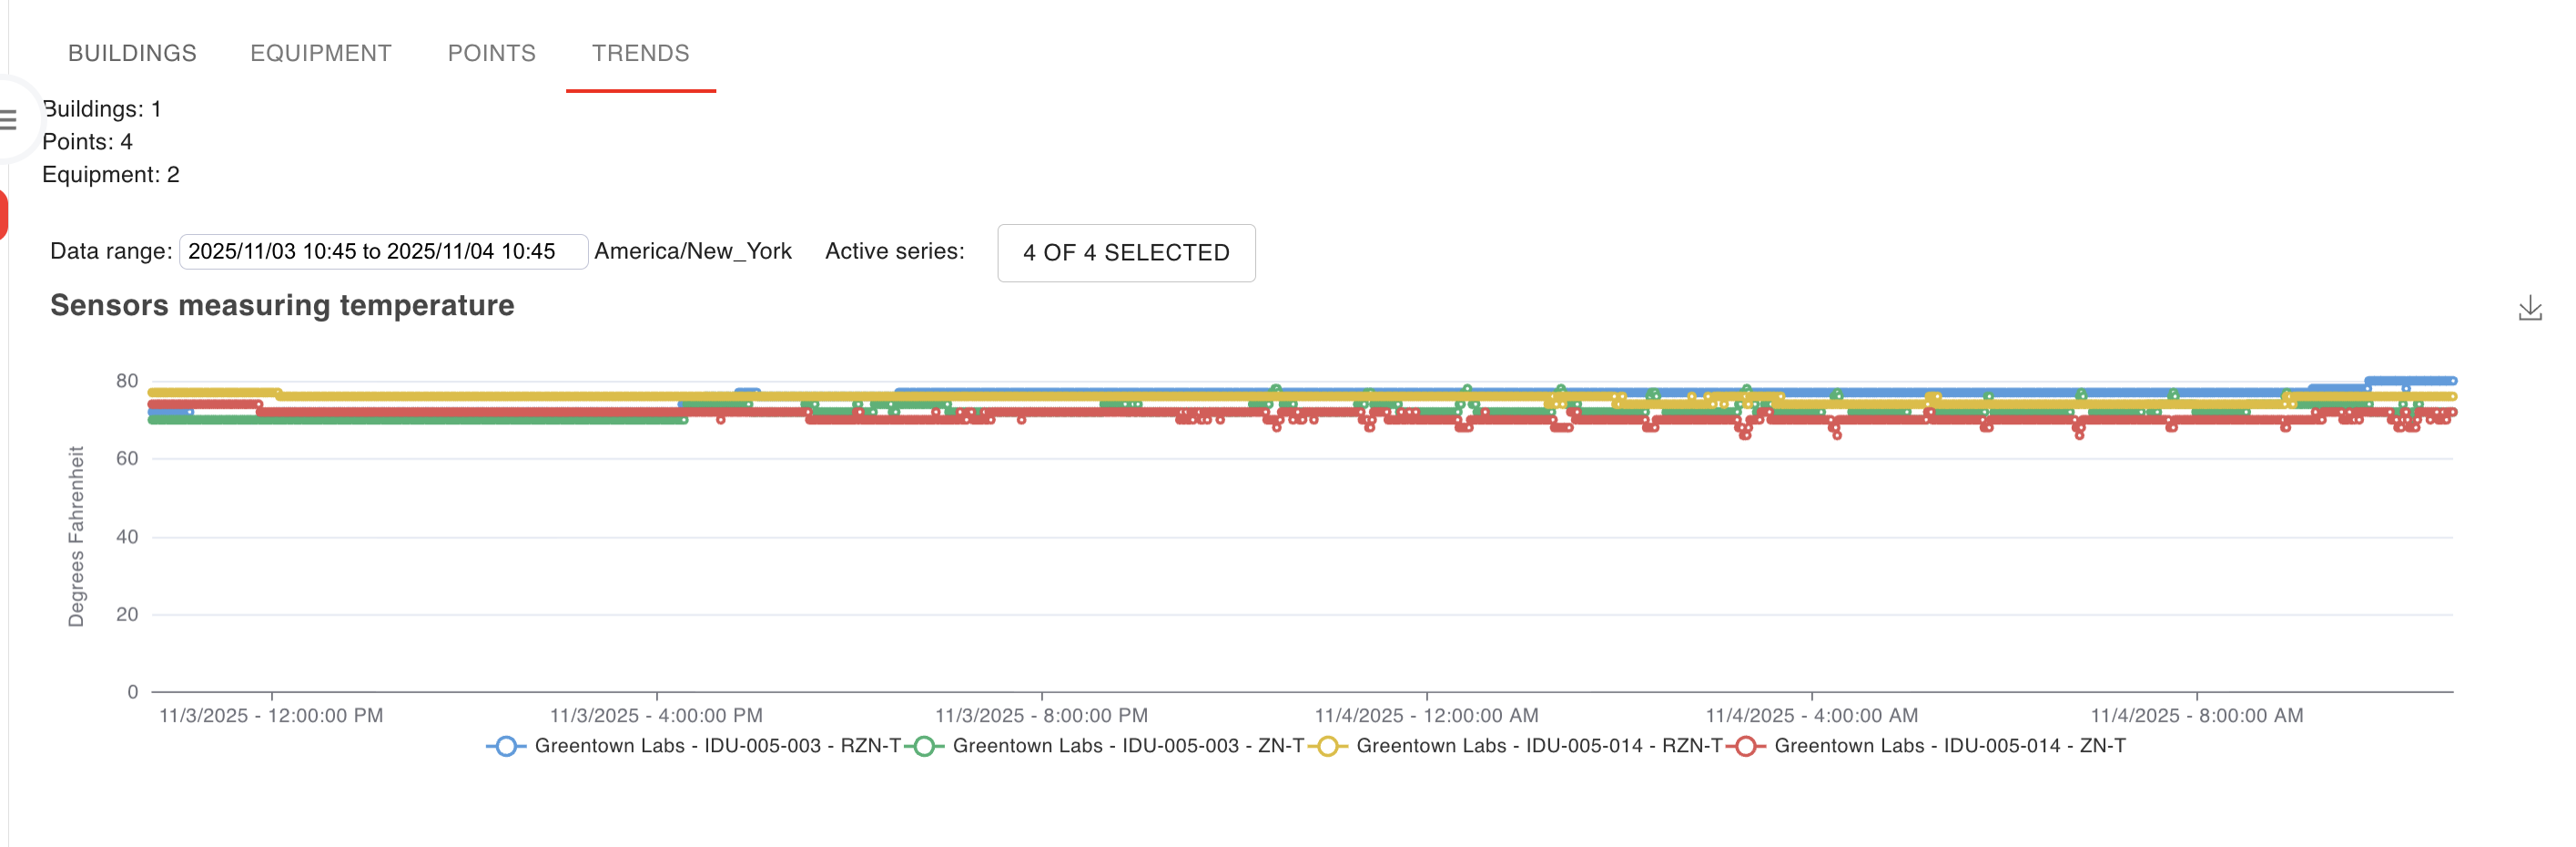
4. Head to the Trends Tab
It visualizes both live and historical time-series data for the selected points, giving you insight into system behavior and performance at a glance. You can also adjust the date range to narrow down the telemetry data and analyze specific time windows instantly.
Notes
- Data Source: The Explorer displays data for equipment and points which been published from Onboard’s Staging Interface
- Performance: Selection is restricted to 10 buildings to maintain speed and responsiveness
- Access Control: Visibility of data is determined by the user’s assigned permissions