Onboard's Data Model Explained
Onboard's Data Model is how we turn raw, messy building data into structured, meaningful information that is ready for you to export, analyze and apply in the real world. It defines the different types of assets in your building.
🧱 The Data Model includes:
- Devices: Physical controllers discovered on your building network via BACnet or Modbus, each containing one or more points
- Equipment: Physical or virtual entities in a building system like AHUs, VAVs, meters, boilers, etc
- Points: Individual sensors, actuators or setpoints in a building. They can monitor conditions, such as temperature or humidity, or control actions, like turning on a fan or adjusting a damper
- Measurements: Units for sensor readings. The QUDT standard is employed by our Data Model
- Locations: Spatial hierarchy of your building such as floors, rooms, corridors or stairwells
- Relationships: Connections between equipment and locations, including FEEDS (e.g., an AHU FEEDS a VAV) and Contains (e.g., a Room contains a VAV)
- Modeling State: Defines the state of equipment and points on Staging, such as Published, Diff, or Validation flags
🔧 From Devices to Equipment
By default, Onboard's Data Modeling Tool, Staging, automatically creates one equipment for each device disocvered by the on-site collector. The equipment then inherits that device's points. This works well when a physical controller maps directly to a single physical system, like a VAV box with its own dedicated controller.
In practice, large building systems aren't always wired under one device. A single physical system, like a rooftop AHU, might be split across multiple devices on the network, ith one controller handling the fan and dampers and another handling the heating & cooling coils, for example. Equipment is virtual rather than physical, meaning it's a placeholder Onboard creates to represent a real system, not a real device itself, so you can override Staging's default grouping and manually combine points from multiple devices into a single equipment that accurately represents what's actually out there.
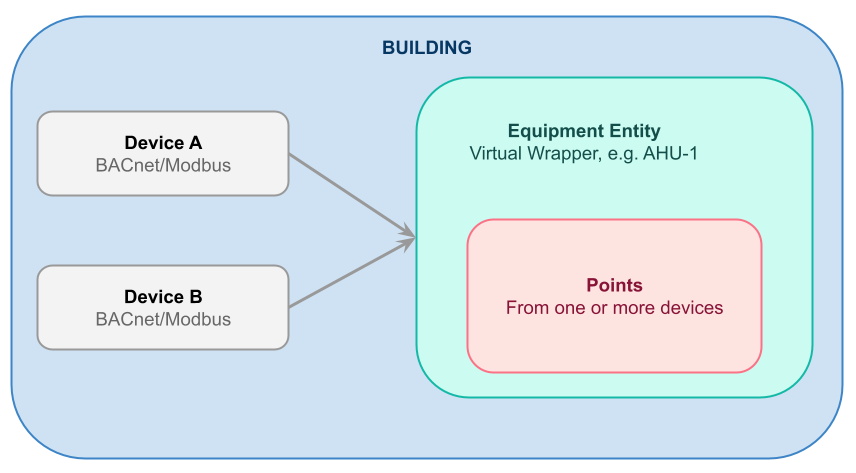
The reverse is also possible: if one device's points actually represent multiple equipment, you can split those points into separate equipment instead. This flexibility means the equipment you see in Staging can always reflect how your building actually works, not just how its devices happen to be wired on the network.
Learn more in Using the Equipment Tab.
🔗 Relationships
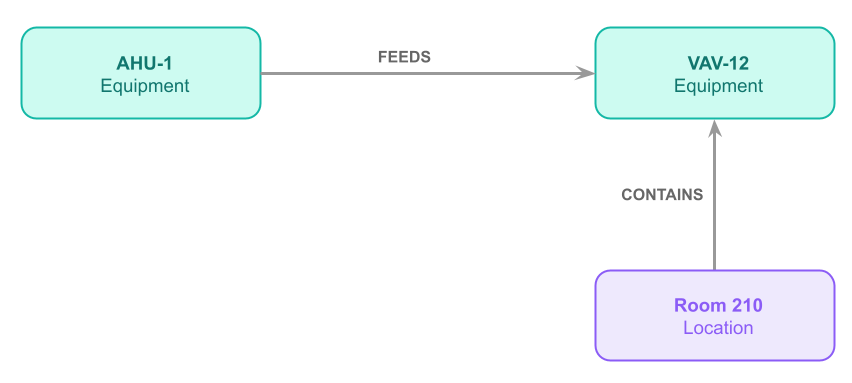
Equipment and locations connect to each other through two named relationships:
- FEEDS: One equipment supplies media (air, water, gas, etc) downstream to another equipment or location
- Contains: A location encapsulates equipment or another location
Learn more in Using the Equipment Tab and Using the Locations Tab.
🏛 Built on Standards
Our data model is based on Google's Digital Buildings Ontology and enhanced with Project Haystack tags for more interoperability. You can also add your own custom labels to support unique use cases. The Ontologies provide the rules and structure, while Onboard's Data Model implements those rules on your building data.
🔌 API-Ready
Onboard's Data Model is easy to consume via the API and can be exported along with your building's time-series data, making it simple to integrate with your workflows.
👉 Visit our Data Model page for a visual look of how your building's assets can be labeled.
📎 To learn more about the foundation behind the data model, check out What is an Ontology in the Context of Building Data?