Getting Started with Staging
Staging is Onboard's AI-powered data modeling interface. Think of it as a 'backstage' where your building data is cleaned, labeled, and organized into a complete model before it goes live on the Explorer. Moving data from backstage to mainstage is done by 'publishing' modeled equipment and their points: label it, validate it, publish it.
This article, along with the ones that follow, will walk you through everything you need to get started: how Onboard's AI models your data, how to navigate each tab, and how to get your data live.
🤖 AI-Powered Modeling
Onboard's AI does the heavy lifting so you don't have to:
- Automatically cleans and organizes raw building data
- Labels equipment and points with high accuracy, surfacing confidence scores you can trust
- Human-confirmed labels are locked, AI will never overwrite them
- Publish high-confidence data immediately while continuing to refine the rest
Learn more about how this works in Onboard AI.
🎨 Modern Interface
Built on Material UI for a fast, consistent experience:
- Data table layout across all tabs
- Advanced filtering by field and state, with shareable URLs to send your exact view to teammates
- Group rows by any column for faster bulk operations
- Keyboard navigation supported throughout
✨ Before You Begin
To use the Staging Interface, you need an Onboard Account and an Onboard Collector deployed at your building. If you don't have an account, talk to us to set it up.
To access Staging, click on the 🔧 icon on the left-hand navigation bar on the Onboard Portal.
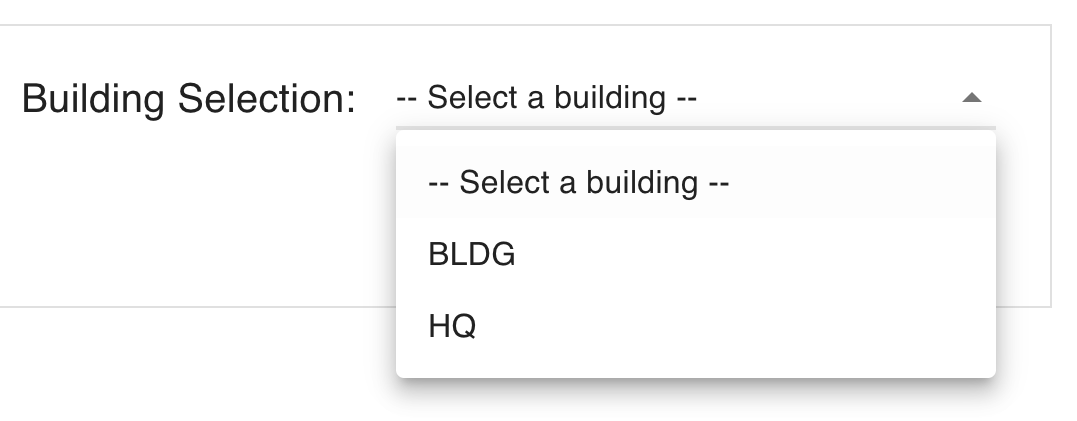
Select a building from the dropdown menu in the top-right corner. This will load all data discovered from the devices in your building's network. Buildings with a high volume of data may take a few seconds to load.
The Staging Interface is composed of multiple tabs, and you can start your modeling journey from any one of them.
📊 Overview Tab
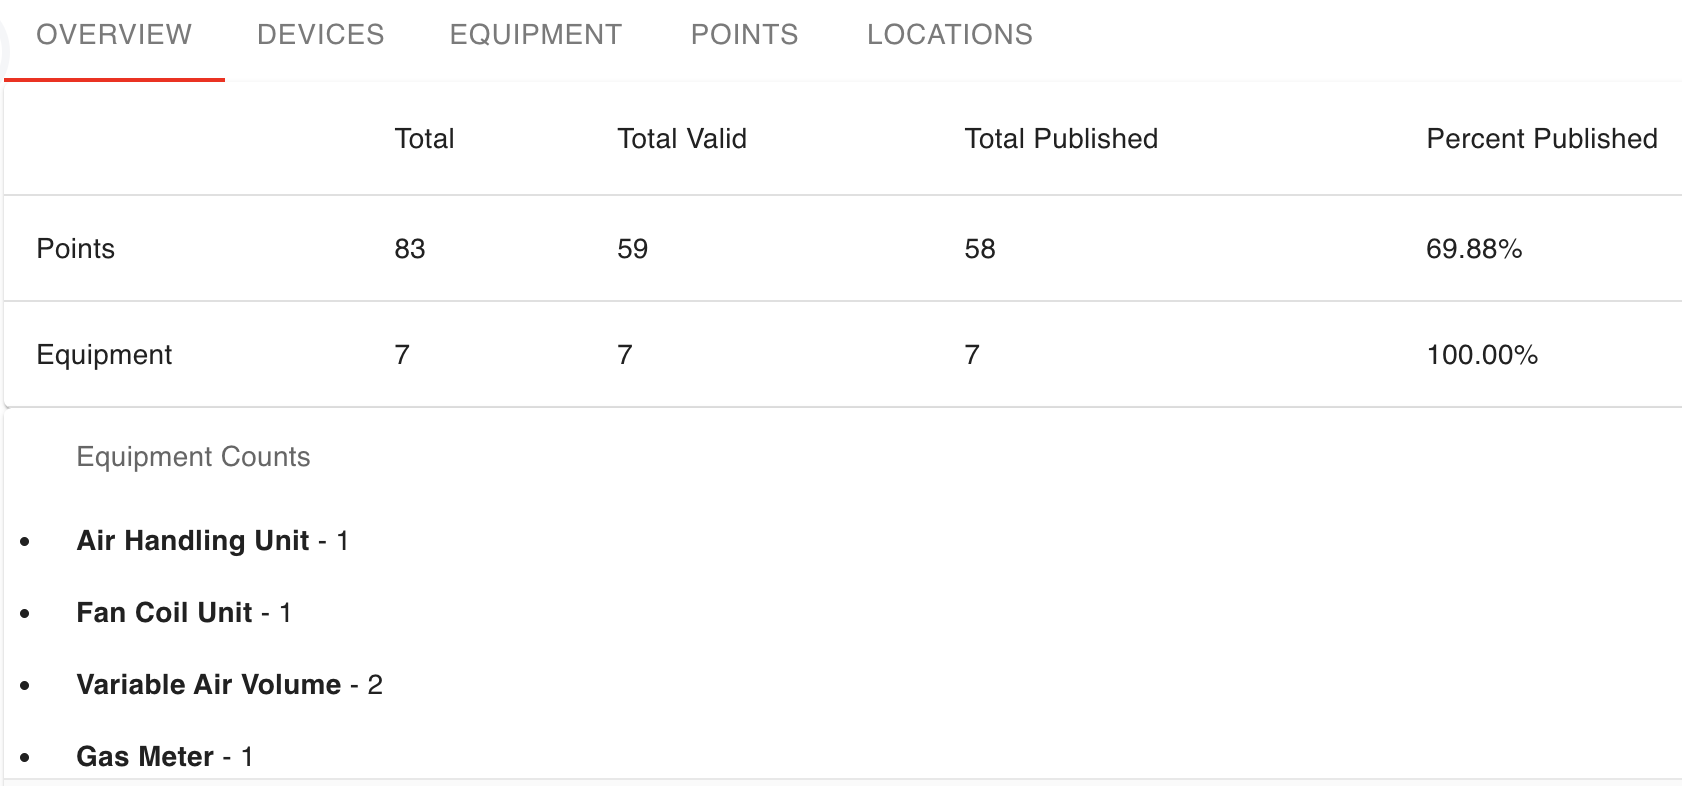
The Overview Tab gives you a snapshot of your building's modeling progress at a glance.
- See every asset discovered in your building, labeled by Onboard's AI
- Track how much of your data has been modeled and published
- Spot equipment that the AI has not yet labeled
- Use this tab to measure completeness before you start streaming data live
🖥️ Devices Tab
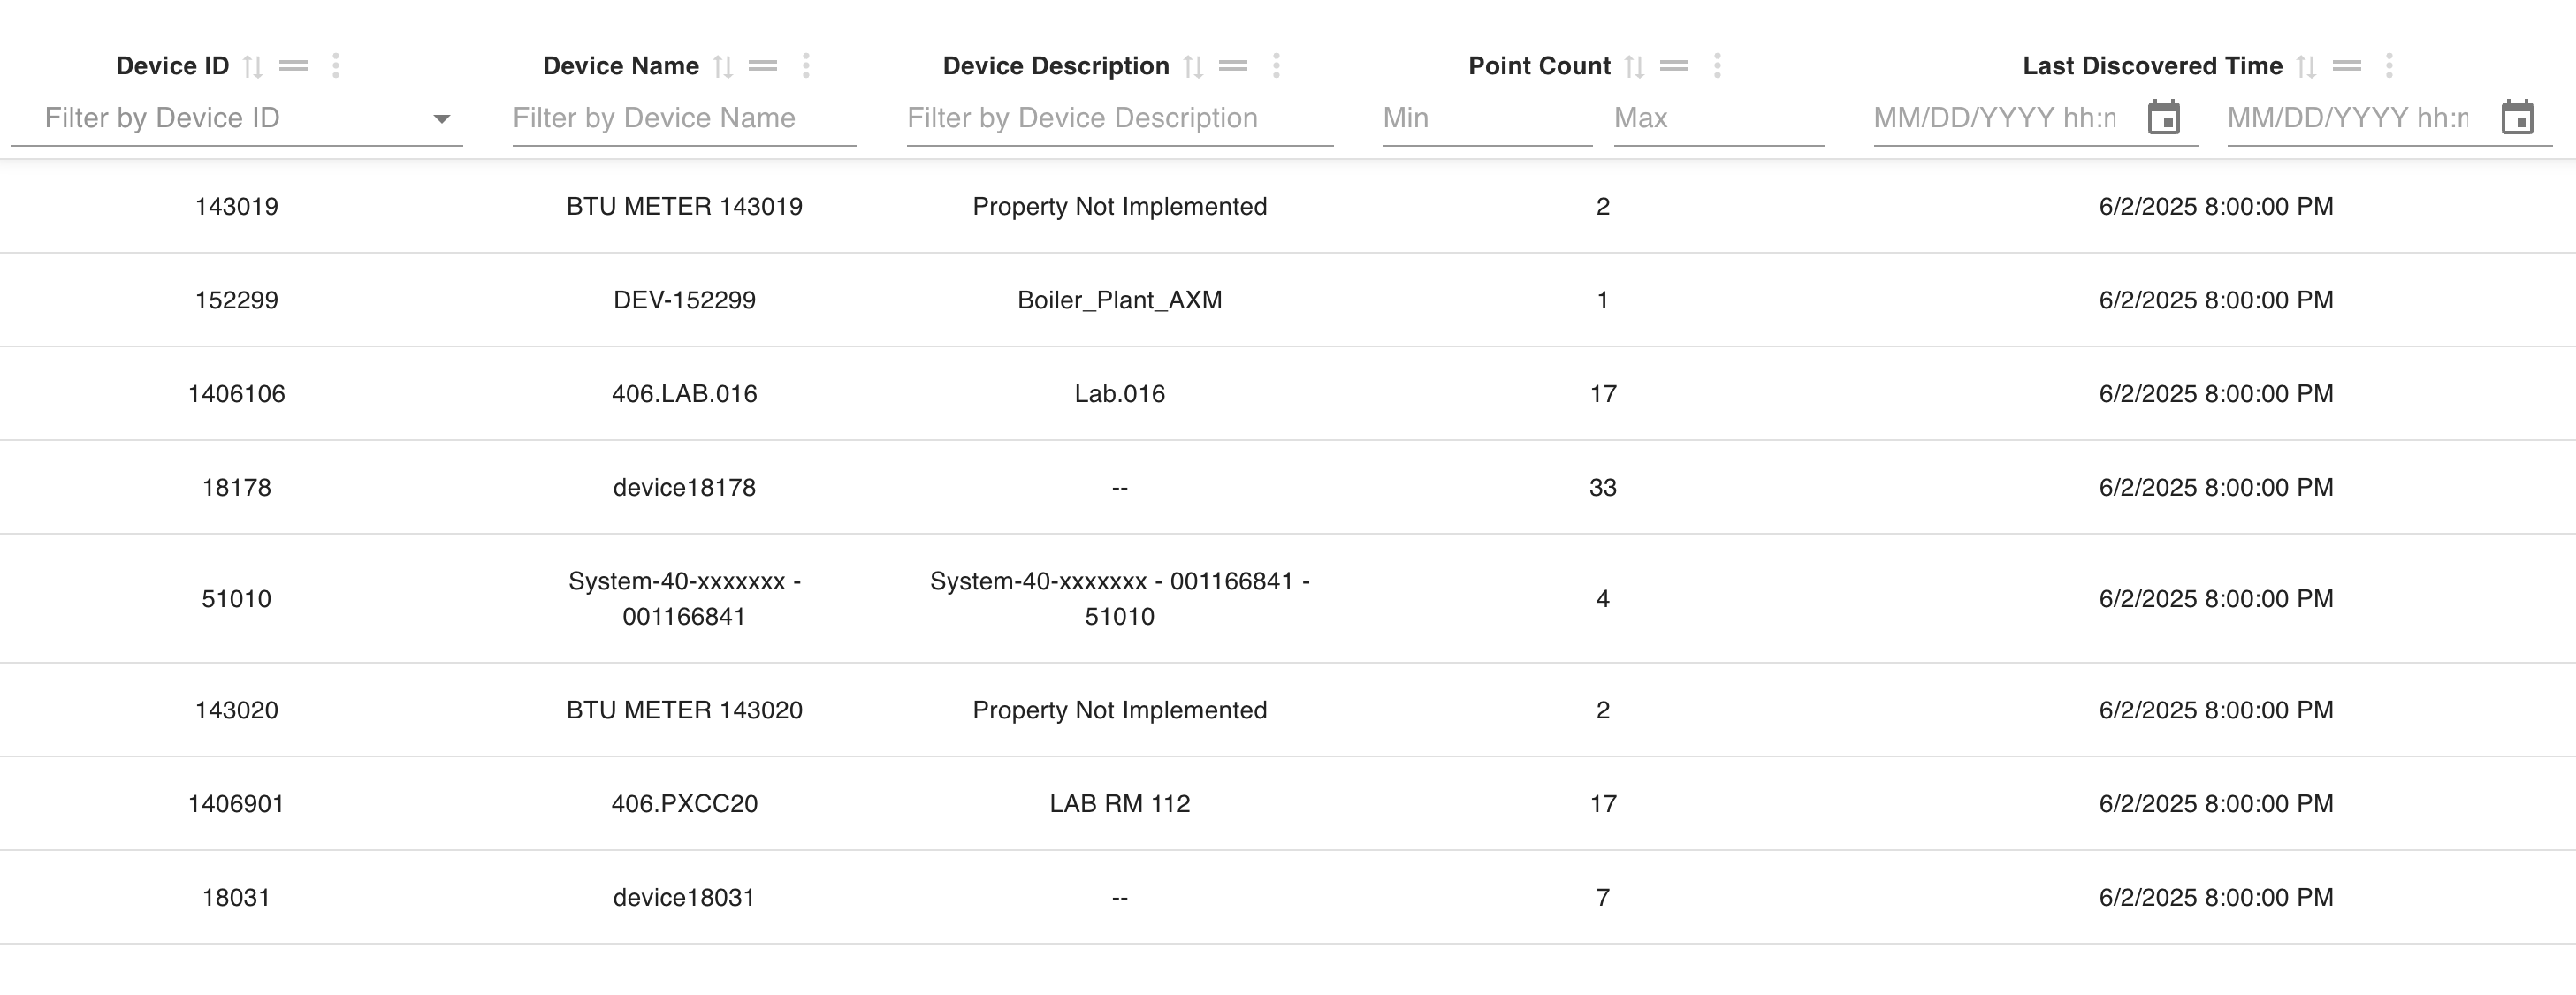
The Devices Tab shows every physical device discovered on your building's network through BACnet or Modbus. These devices are discovered by the on-site Collector deployed at your building.
- Each row represents a unique device
- Review key attributes such as Device Name, Device ID, and the number of points discovered on that device
- Filters help you locate specific devices easily
Each device, along with its points, automatically becomes an equipment on the Equipment Tab, where you can begin labeling and modeling your data.
🧰 Equipment Tab
The Equipment Tab helps you model equipment in your building and publish data from Staging to the live building.
Equipment are the physical or virtual entities in a building system that perform specific functions or contain multiple sensors and actuators. Examples include AHUs, VAVs, pumps, chillers, or lighting fixtures.
- Create, rename, and delete virtual equipment directly from this tab
- See equipment type predictions from Onboard AI directly in the table
- Real-time status shows updates to equipment including validation errors
- Use bulk actions to update equipment type labels, reset equipment to its last published state, or remove it from the live building
Click here to learn more about how to use the Equipment Tab.
🌡️ Points Tab
The Points Tab helps you model the individual points in your building.
Points are the individual sensors and actuators in a building. They can monitor conditions, such as temperature or humidity, or control actions, like turning equipment on and off or opening and closing dampers.
- See point type predictions from Onboard AI along with their confidence scores
- Real-time status shows updates to each point including validation errors
- Assign or unassign points to equipment using the Assign-Unassign Equipment actions
- Use bulk actions to update point type or unit labels, or reset points to their last published state
Click here to learn more about how to use the Points Tab.
📍 Locations Tab
The Locations Tab lets you define the spatial structure of your building, such as Floors, Rooms, Corridors, and Stairwells.
- These locations help place equipment in the physical context of your building
- Makes your data easier to organize and navigate
Click here to learn more about how to use the Locations Tab.