Getting Started with Onboard
Welcome to Onboard. This guide walks you through the core concepts and end-to-end workflow: from connecting your building to exploring and exporting standardized data.
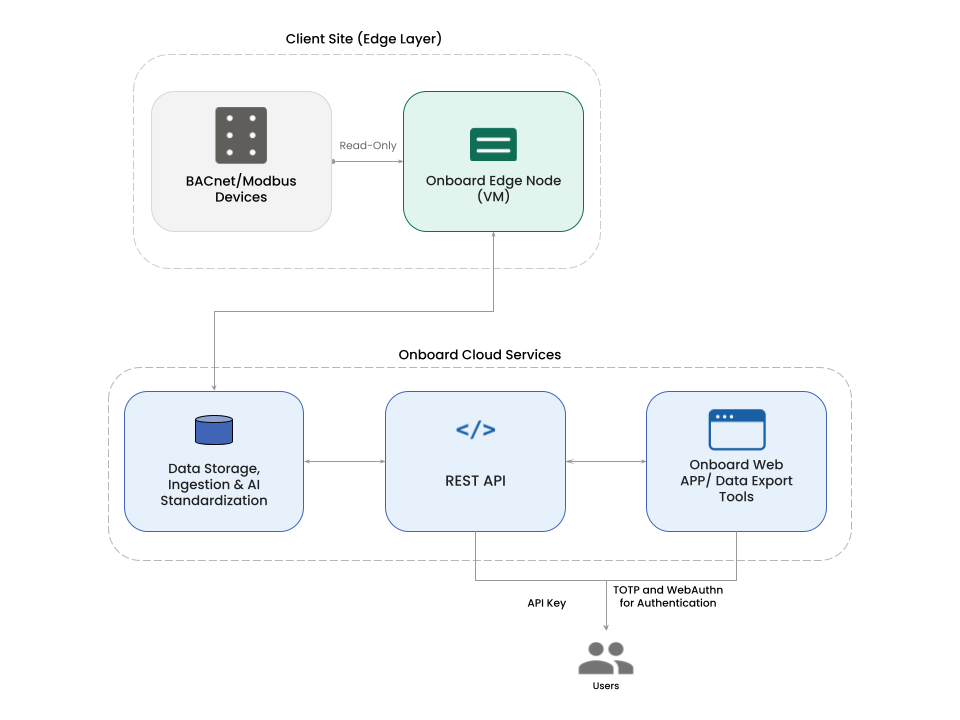
Below is a visual reference of the Onboard Workflow architecture, which we will walk through step-by-step:
🧱 Understanding the Basics
Before diving in, lets first understand the key entities in Onboard: Buildings, Deployments, Edge Nodes, and Collectors. Everything in the platform is organized around these.
Building
A Building is the top-level entity in Onboard. It represents your physical site and serves as the container for all data collected from that location. When you set up Onboard for a new site, you start by creating a Building.
Deployment
A Deployment is associated with a Building and represents an active data collection pipeline for that site. Each Building has one Deployment, and it is the operational layer that manages the Edge Node running at your site.
Edge Node
The Edge Node is Onboard's software that runs on a virtual machine within your building's network. It discovers and collects data from connected systems such as HVAC, meters, and lighting via BACnet and Modbus, then securely transmits it to Onboard's cloud. It is packaged as an OVA file and deployed in a virtualization environment like VMware.
Collector
A Collector is the key that activates the Edge Node for a specific Deployment. When you create a Collector, Onboard generates a configuration file (ISO) that you mount onto the Edge Node VM to tie it to your building and bring it online.
🔄 The Onboard Workflow
Here's how the full workflow comes together:
⬇️ Installation
The first step is creating your Building in Onboard using the Building Launcher. This automatically creates an associated Deployment in the system. From there, you configure a Collector for the Deployment and install the Edge Node on your site.
Onboard's Edge Node is packaged as an OVA file and runs as a virtual machine on a client-managed x86 virtualization environment. Once deployed and activated, the Edge Node connects outbound to Onboard's cloud over HTTPS (TCP port 443), no inbound firewall access is required.
For a detailed guide on requirements and steps, please refer to the Installation section.
📡 Data Collection
Once the Edge Node is installed, you can confirm it is active and communicating in the Onboard App. Once online, you can configure BACnet & Modbus settings and run a discovery on the building network to discover connected devices and begin real-time data collection. BACnet and Modbus can be configured directly from the Onboard App.
🤖 Data Modeling with AI (Staging)
Once connected, your raw building data flows into Onboard's cloud, where Onboard's AI takes over. This process typically completes within 3–4 hours of initial discovery.
Onboard's AI automatically:
- Cleans and standardizes raw device data
- Predicts equipment types, point types, and units of measurement
- Assigns confidence scores so you can quickly identify which labels are ready to publish versus which need review
- Generates the top 5 prediction options for each equipment & point
- Infers equipment relationships (e.g., AHU → VAV) using real telemetry, this deeper relationship modeling can take up to 7 days after the relevant data begins streaming
The result is a clean, structured building data model. Our AI dramatically reduces cognitive load on the user and reduces effort to model your building data.
🌍 Exploring the Data
Once your data is published, it becomes available in the Buildings Explorer, Onboard's unified interface for navigating your building's equipment and points.
From the Explorer, you can:
- Monitor equipment performance in real time
- Compare trends across multiple buildings or systems
- Visualize sensor data over time
- Quickly surface anomalies, or inefficiencies
The Explorer is designed to allow you to move fluidly between buildings, equipment, and individual points in a single interface.
📥 Data Export
For deeper analysis or integration with external workflows, Onboard's Data Export tool lets you extract structured data on demand.
You can:
- Query any equipment or point across any building
- Define custom time ranges
- Specify unit preferences, resampling rates, or data aggregation settings
- Export results in CSV or JSON format
Data Export is ideal for ad-hoc analysis or building audits
</> API & SDK
For teams building their own applications or automations, Onboard provides a full developer toolset.
REST API
Use the API to
- Retrieve equipment and point metadata
- Query time-series values
- Integrate standardized building data into external platforms
Python and R SDKs
Designed for analytics and data science workflows, SDKs help you:
- Build dashboards
- Automate reporting
- Embed building insights into your own products
Onboard becomes your structured building data “backbone,” enabling rapid development without re-modeling or cleaning raw device data.
🔔 Data Alerts
Onboard includes a built-in alerting system to help you stay informed about the health of your building’s data. Data Alerts allow you to monitor key signals such as disruption in telemetry (stale data) or offline deployments so that you can take action before issues escalate.
Once its set-up, you will receive email notifications when a building or its points stop trending or the Edge Node goes offline or loses connectivity
Putting It All Together
From your building devices → Edge Node → secure cloud ingestion → AI standardization → Explorer and Alerts → Data Export and APIs, the Onboard ecosystem delivers a fully integrated, end-to-end workflow. Each step works seamlessly together to ensure accurate data collection, a trusted standardized model, and fast access to insights.
Explore our Knowledgebase to dive deeper into the specific modules that support your workflow.